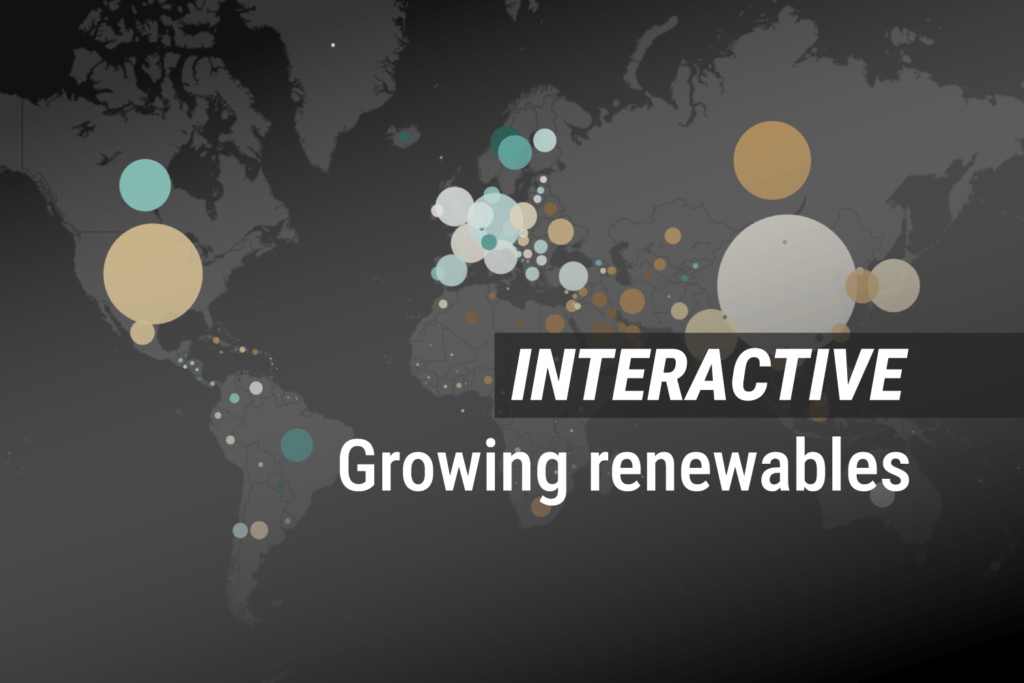
Explore our interactive map illustrating the rise of renewables over the last 20 years.
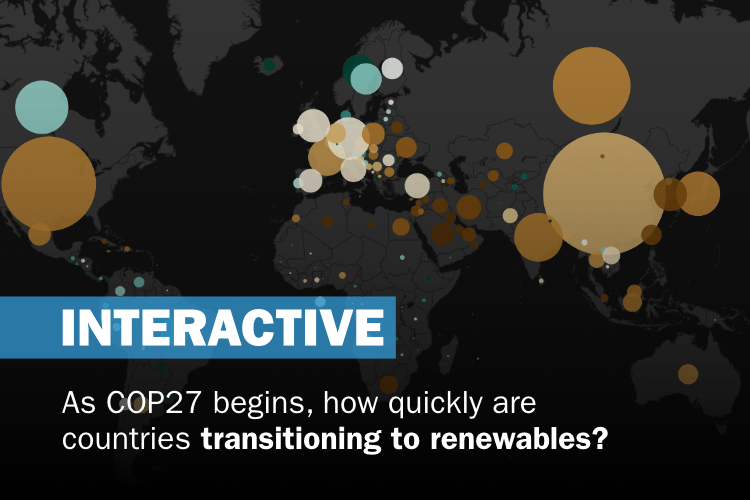 How quickly are countries transitioning to renewables? : James Goldie, 360info CC BY 4.0
Explore our interactive map illustrating the rise of renewables over the last 20 years.
As COP27 continues in Sharm El Sheikh, Egypt, 360info’s Reece Hooker notes that the shadow of several crises loom large over negotiations. There is no one technological solution to decarbonisation, but one success story has been the fall in renewable energy prices over the last 20 years.
In our interactive map below, see how the take-up of renewable electricity has progressed across the world. The largest economies still have a lot of work to do to fully decarbonise their electricity systems, but renewables now make up a significant portion of most major economies’ electricity supply.
Originally published under Creative Commons by 360info™.
Editors Note: In the story “Energy transition” sent at: 11/11/2022 11:56.
This is a corrected repeat. Minor fix to map embed to facilitate sharing.


